Levels
What is a fair value gap
A hole in the chart where price moved too fast to trade properly, and what usually happens to it.
A fair value gap is the space left when three candles in a row do not overlap. Take
any three candles: if the first candle’s wick and the third candle’s wick miss each
other, the gap between them never traded properly. Price moved through that area so
fast that one side never got in.
Why it tends to fill
An area that only traded in one direction has unfinished business. Buyers who
wanted in at that price never got filled and sellers never got to defend it. Price
often comes back through to trade it properly before continuing. It does not always,
and treating it as a rule is how people lose money on it.
Fair value gap size is the whole thing
Most gaps on a one minute gold chart are two or three pips of nothing. They fill
because everything fills eventually, not because the gap meant anything. We tested
this on our own data and the useful ones start at about ten pips. Below that a gap is
just a fast candle.
Which is why the ones we mark on the live chart carry their size in the label. A
gap worth watching says so.
Where it fits
On its own a fair value gap is a weak reason to do anything. It gets useful when it
sits inside something else that already matters, an order block, the previous day
high, the edge of the Asian range. Two reasons in the same place is a level. One
reason on its own is a shape.
Free download
Gold Levels Cheat Sheet (PDF)
Order blocks, fair value gaps, PDH and PDL, and the session times in nine countries. Two pages, no email needed.
How we use fair value gap on the live chart
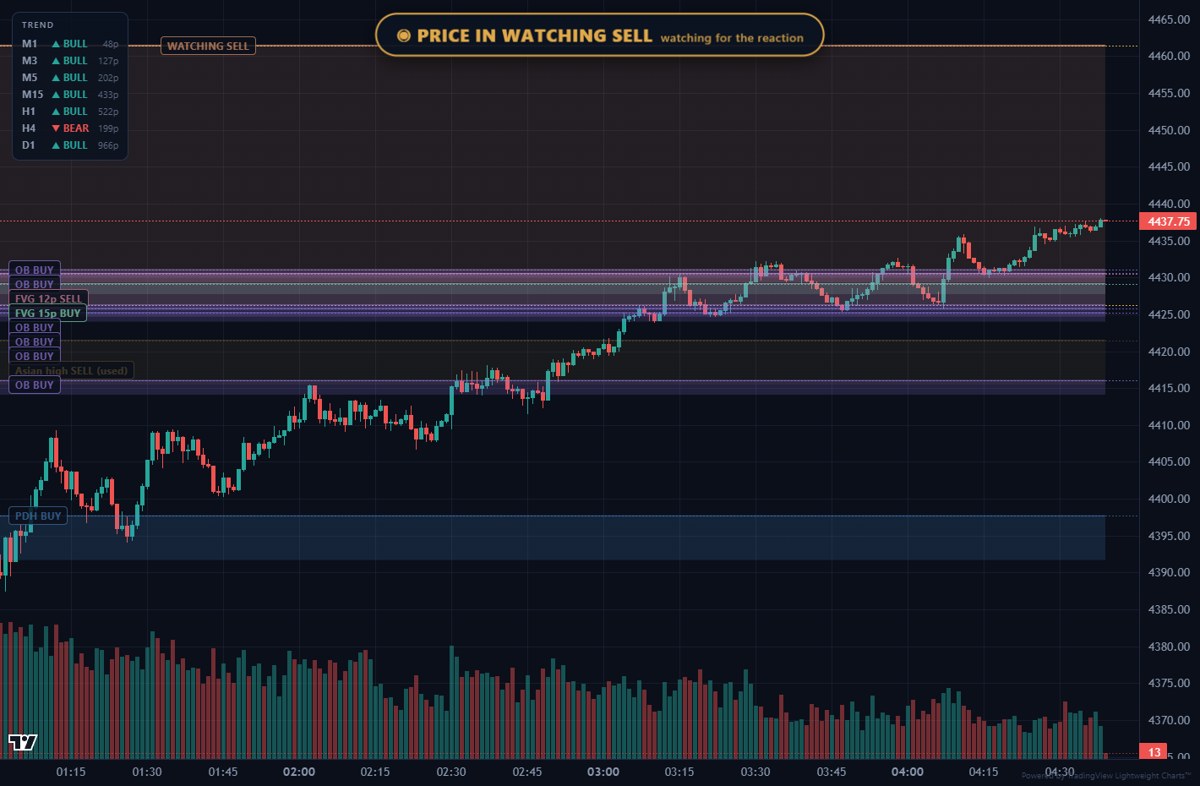
Everything above is marked on our chart while the session runs, not drawn in afterwards. Fair value gap goes on before price gets there, never after. The zones get shaded, each one carries its name and its price range, and a zone turns pale once price has already been through it. When price is sitting inside one, a banner says so on screen. That is deliberate: a level you only see after the move has happened proves nothing.
The panel in the corner shows whether each timeframe is above or below its 50 EMA, from one minute up to the daily, and how far away that average is in pips. When the short timeframes disagree with the daily, the level usually holds. When they all point the same way, it usually breaks. That is not a rule, it is a lean.
Gold is not a quiet market. It can move a hundred pips in an hour on a headline and spreads widen when it does. Position size matters more than entry on an instrument like this, and a stop belongs on the far side of the level rather than right against it. The World Gold Council publishes the demand and supply data behind the longer term moves if you want the fundamental side.
See fair value gap live
We run a live chart through every session with fair value gap marked on it, the zones shaded, and every order block and fair value gap labelled as it forms. Watch the live chart and you can see fair value gap being used in real time rather than explained after the fact.
Every trade we close is published in pips on the results page, wins and losses both, with the date it closed and how far it ran before the exit. Nothing is left out and nothing is cherry picked. If you want to know what your own spread and commission are taking out of your results, the cost calculator works it out for a year on your own numbers.
Related: gold trading hours · order block · fair value gap · PDH and PDL
Education only, not financial advice. Trading gold carries a high level of risk and past results do not predict future results.